
Welcome to the Solar Panel Optimizer
Solar panel optimizer allows you to model solar panels anywhere in the world: by modeling the position of the sun throughout the year you can simulate your solar project and calculate the power and payback of your solar project before you install the panels. You set the site latitude and electric rates for your local area. When you are finished, a complete report is emailed to you. Membership is required, but you can sign up for free.
Solar panel Optimizer is the ONLY site on the Internet that is designed with Time-of-Use rates in mind. Existing solar systems often face south, which does not provide a good return with rates shiting to the afternoons, as with most Time-of-Use rates.
Click here for a sample report
Time of use
Example rates, per kWh:
June though September: Weekdays:
Midnight - 9 am: 10 cents
9 am-4 pm: 14 cents
4 pm- 7 pm: 32 cents
7 pm - 9 pm: 14 cents
9 pm - midnight, 10 cents
Graphically, it looks like this:
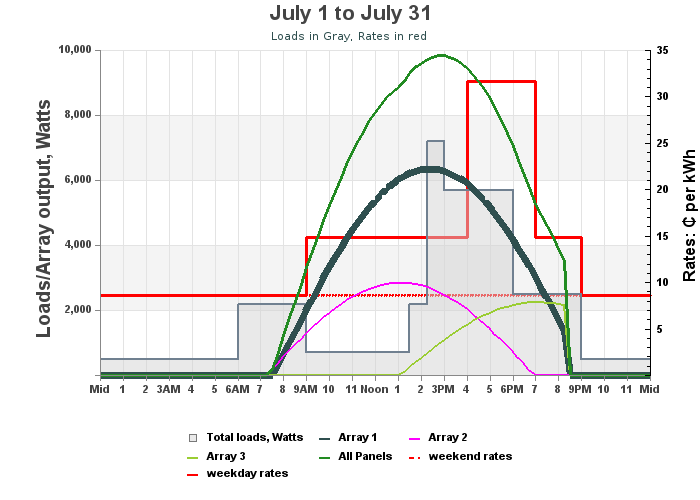
This is an actual plot from the sample site, which is preloaded for all members. You can do a lot of things with the sample site, but you can't change the size or angles of the arrays. Of course, with a paid membership you can add or sustract arrays, resize them, even change inverter topologies.
So let's look at this graph, which shows three arrays, one facing Southwest(dark green), one facing South(pink) and a vertical one facing West (light green).
Traditional panels point South, but with "Time of Use" you want panels that produce power during the highest rate period, in this case 4-7 pm in the months June through September.
Because of the nature of the rates and the loads, the best array in the sample site is the southwest one:
As long as the power generated by the panels exceeds the power required by the loads, no power is purchased from the utility. Note that there are several periods when the loads, which are shown in gray, exceed the power produced by the panel. One is when the combination of the pool pumps and the air conditioner exceed the power produced. This can be corrected by moving the pool pumps to a time earlier in the day when power is available. Morning loads and evening loads occur during darkness, electricity must be purchased during those times, and any need for the air conditioner late in the day results in need grid power too, in this case only about 1500 Watts for about an hour.
Adding the south or west panels lowers the value of the investment, increases the payback period and decreases the net present value of the investment. In fact, adding these panels makes it so the utility makes more money off the solar array than the homeowner. This is due to the fact that the "net meter" rate, or the rate the utility pays for power, is less than what the utility charges. For exampole, in this case, SMUD pays about 6 cents per kilowatt hr for excess generation, and then reseels that same power for 32 cents per kilowatt hour. Thats good business. Even when the rate is low, say before 4PM at just 15¢/kWh, the utility buys excess power for only 6¢/kWh, for a gross margin of 60%, or two and a half times what they are paying. Since excess power is just shipped locally, it's doubtful that any utility company assets, such as generators or transmission lines are used.
Now the biggest misconception: "Move your loads to the nighttime when the rates are the lowest." This is exaclty wrong for the solar system. The solar PV arrays cannot generate any electricity at night, so you are guaranteed to buy electricity from the utility during that time.
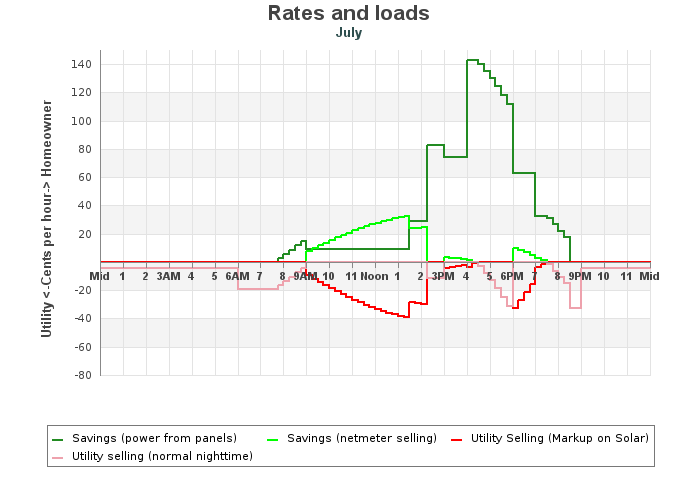
A more detailed look at how money is generated by the panels for both the utility and the homeowner shows why you must know the expected loads.
Money is generated in four ways:
For the utility:
1. Normal selling, especially at night when the solar arrays cannot produce any power due to darkness.
2. Resselling overproduction at a markup. Buys power at 6¢/kwh and sells it to the neighbor at 32¢, a markup of over five times! without using any of its own generating or transmission assets.
For the homeowner:
1. Any savings from running loads that can be run by the panels, savings are equal to the current rate.
2. Netmetering, if allowed, means that the utility pays for excess power generated. In the example, the Sacramento Municipal Utility District pays less than 6¢/ kwhr and resells the power at the going rate, up to 32¢/kwhr.
For the month of July that looks like this on the typical day:
July |
||
Power produced from panels, kWh: |
1,680 |
|
Savings due to power from panels: |
$178.35 |
|
Money earned by net metering: |
$39.99 |
|
Utility sells power (normal selling): |
$44.26 |
|
Utility sells power that panels produce at current rate: |
$52.74 |
|
Net Savings: |
$218.34 |
|
Net Electric bill: |
$4.27 |
|
Once all the months are calculated, the annual returns can be calculated:
Annual Returns |
||
Total power production, kWh: |
12,694 |
|
Savings due to power from panels: |
$937.48 |
|
Money earned by net metering: |
$396.39 |
|
Utility sells power (normal selling): |
$704.16 |
|
Utility sells power to others that panels produce at current rate: |
$513.33 |
|
Net Savings: |
$1,333.87 |
|
Net Electric bill: |
$307.78 |
|
From this analysis, it is clear that for a given period of time, both the homeowner and the utility can be making money at the same time. If the panels produce power in excess of the required loads, the homeowners return is equal to the load times the current rate, plus the excess at the "net meter" rate. The utulity's return, at the same time is the current rate, less the "net meter" rate. If you point your panels in a direction too southerly, or oversize them, you benefit the utility more than yourself.
Only by knowing the loads can you optimize your system!
Lastly we need to consider the role of house batteries. During the day, the solar panels charge the batteries, which are then used to power the loads during the day.
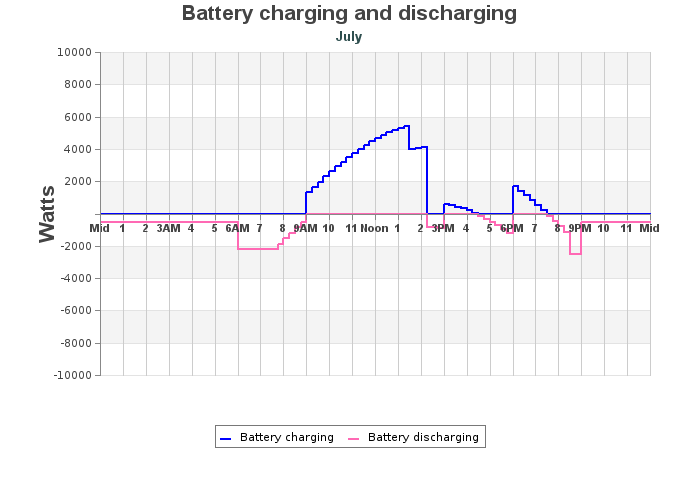
July battery |
|||
Charging |
21.6 kWh |
Discharging |
13.3 kWh |
Of course there is a lot less sun in the winter than the summer, so you would need a larger battery, or draw some power from the grid.
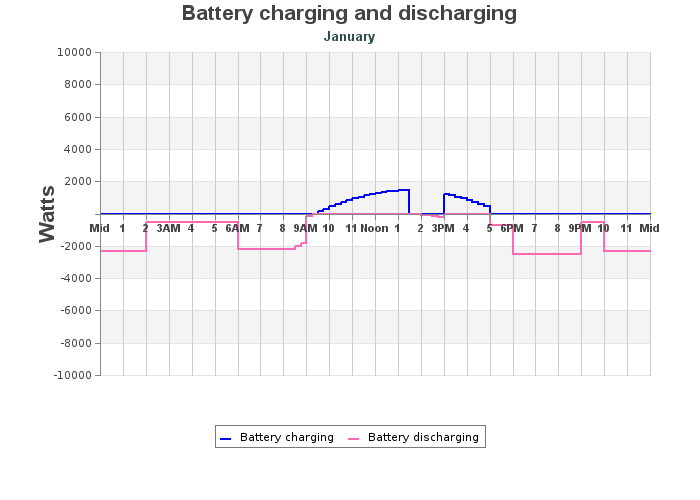
January battery |
|||
Charging |
5.6 kWh |
Discharging |
26.6 kWh |
Of course the real answer here is to calculate all these factors, for all arrays throughout the year to calulate your estimated utility bill throughtout the life of the equipment.
You need to estimate the escalation, or how much the rates are going to increase each yuear, the degradation, since all panels lose generating capability over time, and the discount rate, or risk percentage.
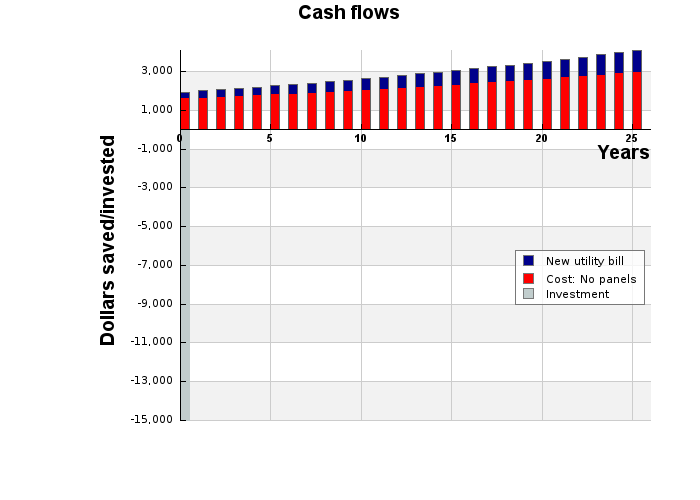
Stored values |
|
| Escalation, % | 3.0 |
| Degradation, % | 1.0 |
| Discount rate, % | 5.0 |
| Life, Years | 25 |
Computed Values |
|
Net Present Value, $ |
$7,781.33 |
Payback Period, years |
12.9 yrs |
Rate of return (IRR) |
10.1% |
All of these charts are calculated for your specific system. Even after your system is designed, you can move the loads to optimize the return. Moving loads to fit under the power generated by the panels will increase your return on investment and lessen the payback period.
Solar is no longer about generating power, it is about SAVING MONEY
Click here for a sample report
Advanced Features
Solar Panel Optimizer is the only site that can change your expected loads thoughout the year. Heating, cooling and lighting loads will vary according to the calendar and according to the hour of the day. Your solar system should be sized according to your needs. Here you can build a model by describing your loads.
Additional features
Net metering: when your meter runs backwards, you can sell power back to the utility, but at what rate? Our optimizer accounts for this as well.
This website was started in 2008, before the widespread use of "smart" meters by the utilities. With older meters, a person came once a month to determine usage (the "meter reader"). By 2018 this is going to change for almost all utilities in the world. This means that for a given day, the rate you are charged for electricity can change many times. The most common plan is for the rate to change five (!) times. The peak rate corresponds with the time when the utility claims wholesale rates are the most expensive and residential usage is the highest.